LTC Pharmacy Data Analytics
Revolutionizing Decision-Making for Long-Term Care Pharmacies
Our Business Intelligence (BI) application is purpose-built for Long-Term Care Pharmacies, offering powerful insights that drive smarter, real-time decision-making. With an intuitive and dynamic dashboard, pharmacy owners and operators can track key performance indicators (KPIs) such as Facilities, Patients, Cost for Period, Average Cost Per Patient, and more.
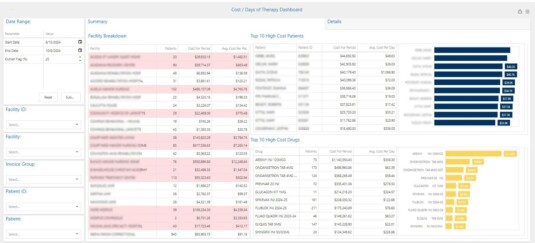
The Cost Per Days of Therapy Dashboard provides a comprehensive overview, including detailed analytics like Top 10 High-Cost Patients and Top 10 High-Cost Drugs, empowering pharmacies to optimize operations and reduce costs.
Dive deeper with our detailed facility and patient-level insights, which include granular data on Drug Utilization and Advanced Filtering capabilities to customize reports according to your needs.
Harness the power of data to uncover opportunities, improve operational efficiency, and deliver better care. Our BI solution transforms complex data into actionable intelligence, enabling your pharmacy to stay ahead in an increasingly competitive healthcare landscape.
Take control of your pharmacy’s performance today with our Business Intelligence application designed exclusively for Long-Term Care Pharmacies.
Featured Dashboards
Cost Per Days of Therapy
Facility Breakdown
Top 10 High Cost Patients
Top 10 High Cost Drugs
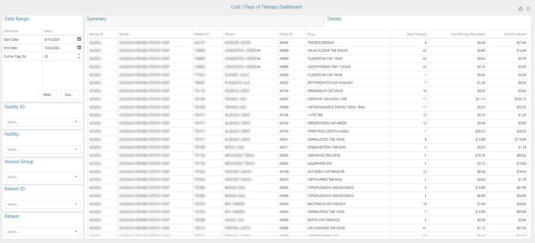
Details Headers
Facility ID - Facility Name
Patient ID - Patient Name
Order ID - Drug
Days of Therapy - Cost Per Day
Cost for Period
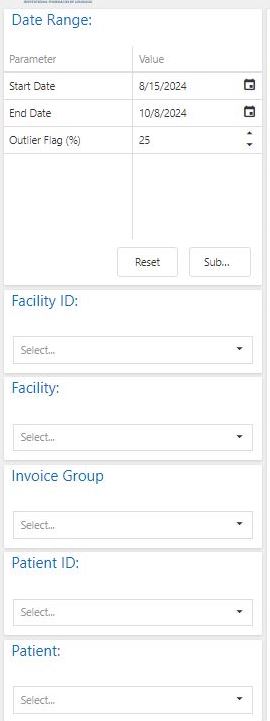
Advanced Filtering
Start - End Date
Outlier Flag - Set Flags to Highlight High Cost Percentage Thresholds
Facility ID
Facility Name
Invoice Group
Patient ID
Patient Name
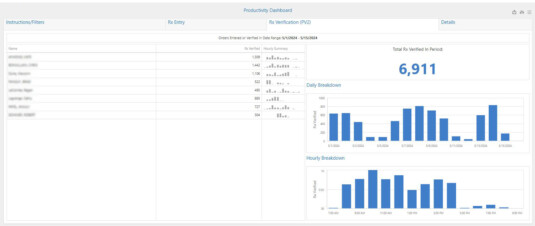
Productivity Dashboard
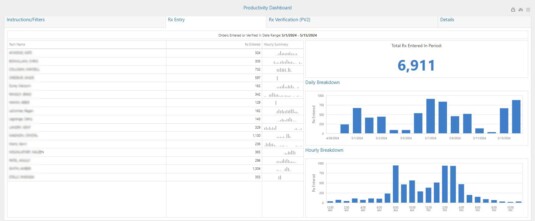
Tech Name - RX Entered
Total RX Entered in Period
Daily Breakdown
Hourly Breakdown
Advanced Drill Down Functionality
Pharmacist Name - RX Entered
Total RX Verified in Period
Daily Breakdown
Hourly Breakdown
Advanced Drill Down Functionality
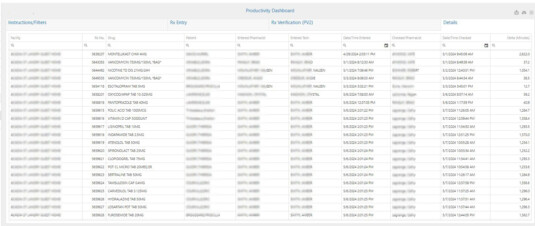
Details Headers
Facility - RX Number
Drug - Patient
Verified Pharmacist - Entered Tech
Date/Time Entered - Checked Pharmacist
Date/Time Checked - Delta (in minutes)
Searchable - Sortable - Download to XLS
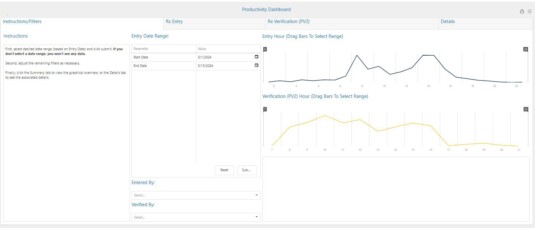
Advance Filtering
Date Range
Entered By
Verified By
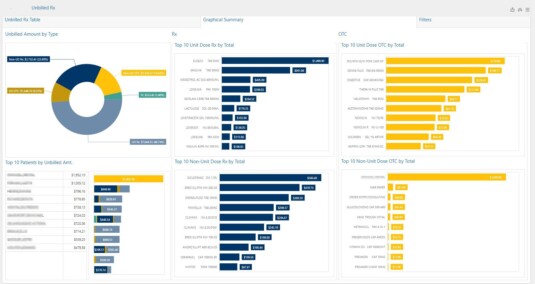
Unbilled RX
Unbilled Amount by Type
Top 10 Unit Dose by RX
Top 10 Unit Dose OTC by Total
Top 10 Patients by Unbilled Amount
Top 10 Non-Unit Dose RX by Total
Top 10 Non-Unit Dose OTC by Total
Unbilled Transaction Details
Advance Filtering
Highly Customizable
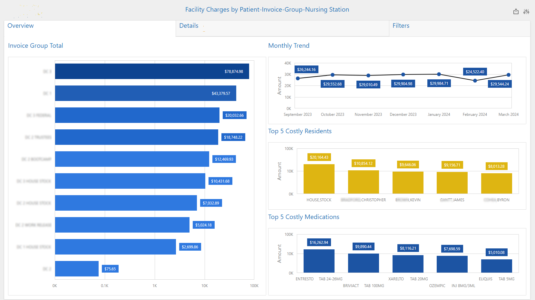
Facility Charges by Patients - Invoice Group - Nursing Station
Invoice Group Total
Monthly Trend
Top 5 Costly Residents
Top 5 Costly Medication
Drill Down On: Invoice Group - Monthly Total - Resident - Medication
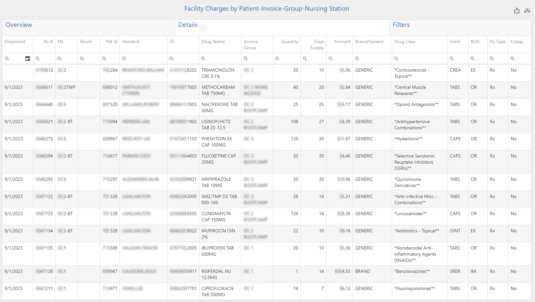
Data Details
Search and Filter on Each Column
Download to Excel
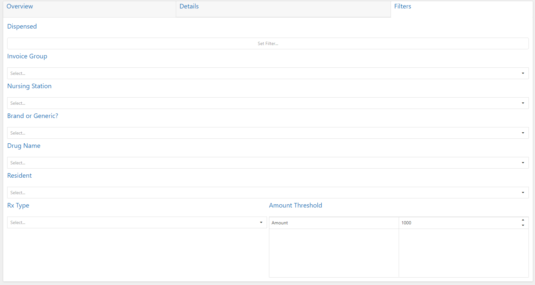
Advanced Filtering
Dispenced Date
Invoice Group
Brand or Generic
Drug Name
Resident
RX Type
Set Amount Threshold Flags
Quality Events Dashboard
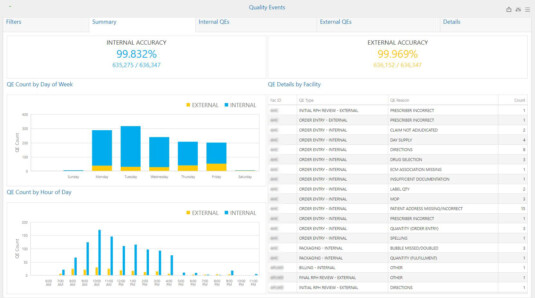
Quality Events Summary
Internal Accuracy
External Accuracy
QE Count by Days of Week
QE Count by Hour of Day
QE Details by Facility
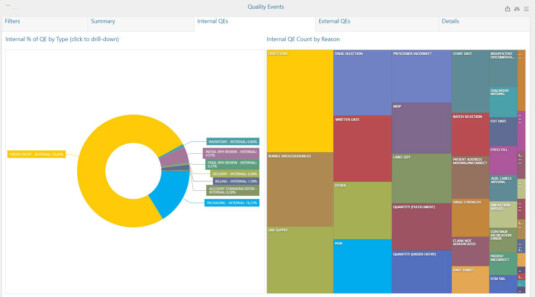
Quality Events Internal QEs
Internal Percentage of QE by Type
Internal QE Count by Reason
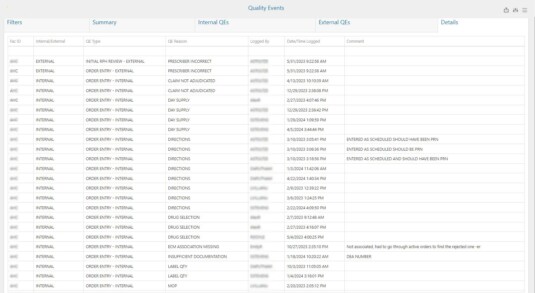
Quality Events Details
Facility ID
Internal or External Event
QE Type
QE Reason
Logged By
Date/Time Logged
Comment
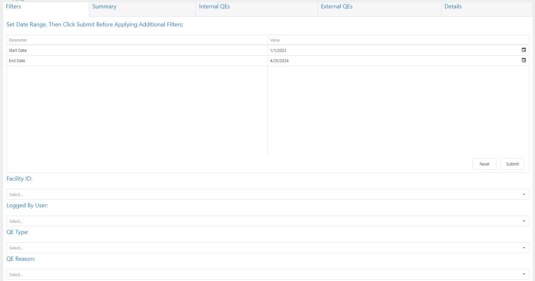
Quality Events Filters
Date
Facility
Logged by User
QE Type
QE Reason
Sales Trends and Forecasting Dashboard
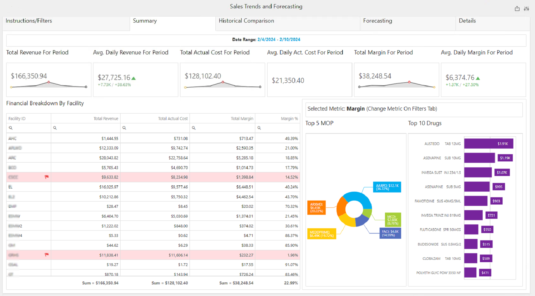
Revenue and Cost KPI's
Financial Breakdown with Drill Downs
Top 5 Method of Payments
Top 10 Drugs
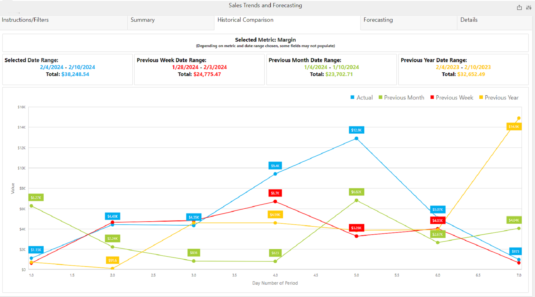
Comparative Date Range Visual
Previous Week
Previous Month
Previous Year
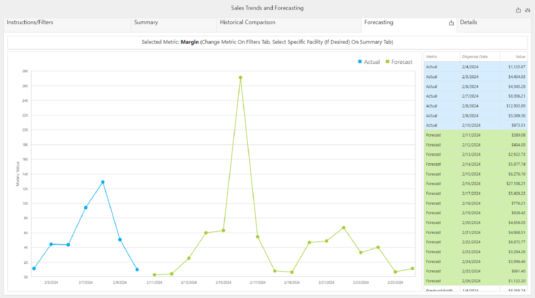
Sales Forcasting Based on PreviousTrends
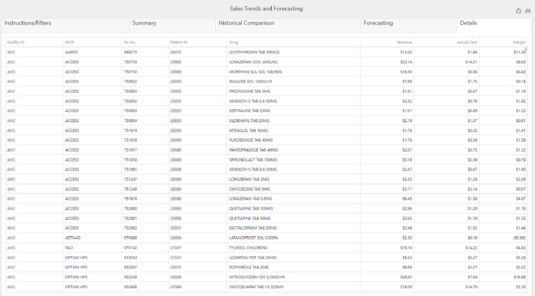
Sales Trends Detail
Download to Excel
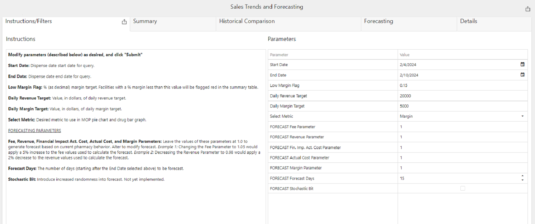
Advanced Filtering
User Data Input For:
Low Margin Flags
Daily Revenue Targets
Daily Margin Targets
All Data Input Affects KPI Output
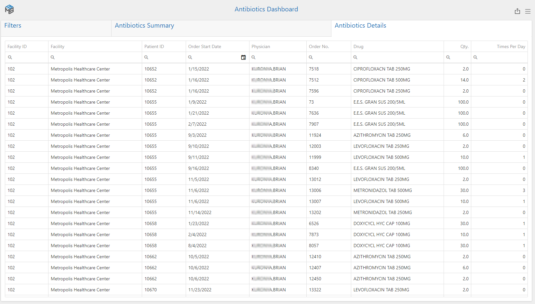
Facility Portal - Antibiotics Dashboard
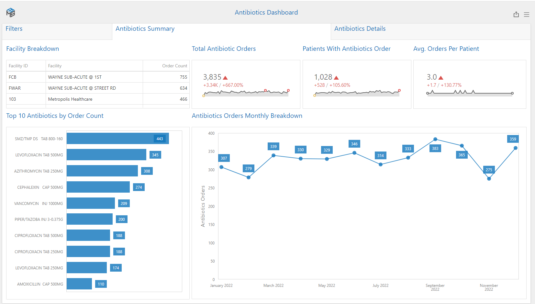
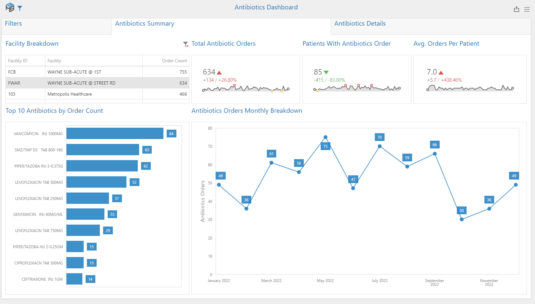
Antibiotics KPI
Facility Breakdown
Total Antibiotic Orders
Patients With Antibiotic Orders
Average Orders Per Patient
Top 10 Antibiotics by Order Count
Antibiotic Orders Monthly Trend
Drill Down by Facility and Medication
Antibiotic Data Details
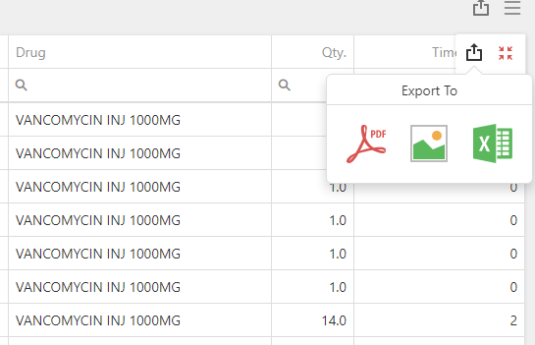
Export to PDF, JPG or XLS
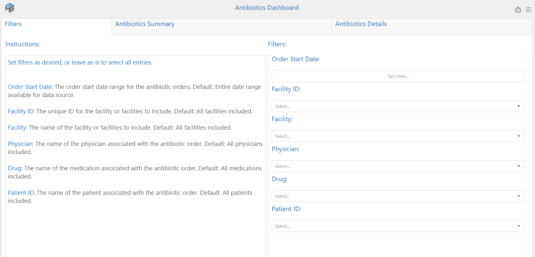
Multiple Filtering Options:
Date Filter
Facility ID
Facility Name
Physician
Drug
Patient ID
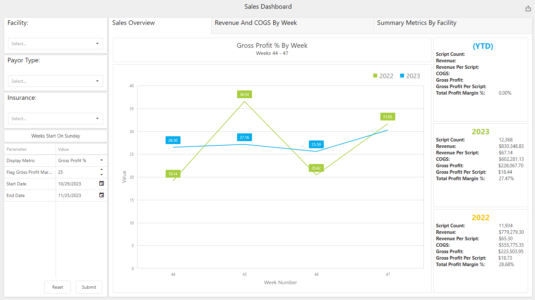
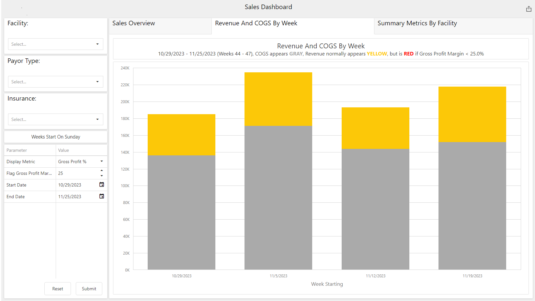
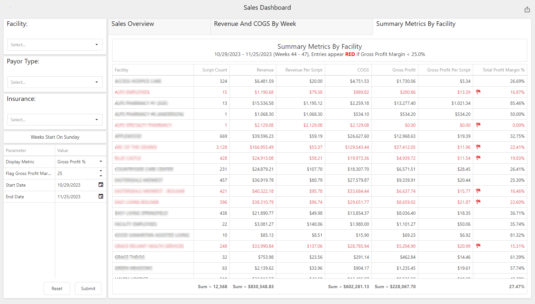
Sales Dashboard
Gross Profit by Week Visualization
Multi - Year Comparison
COGS by Week
Cost of Goods Total and Revenue Total
Summary Metrics By Facility
Facility
Script Count
Revenue
Revenue Per Script
COGS
Gross Profit
Gross Profit Per Script
Total Profit Margin
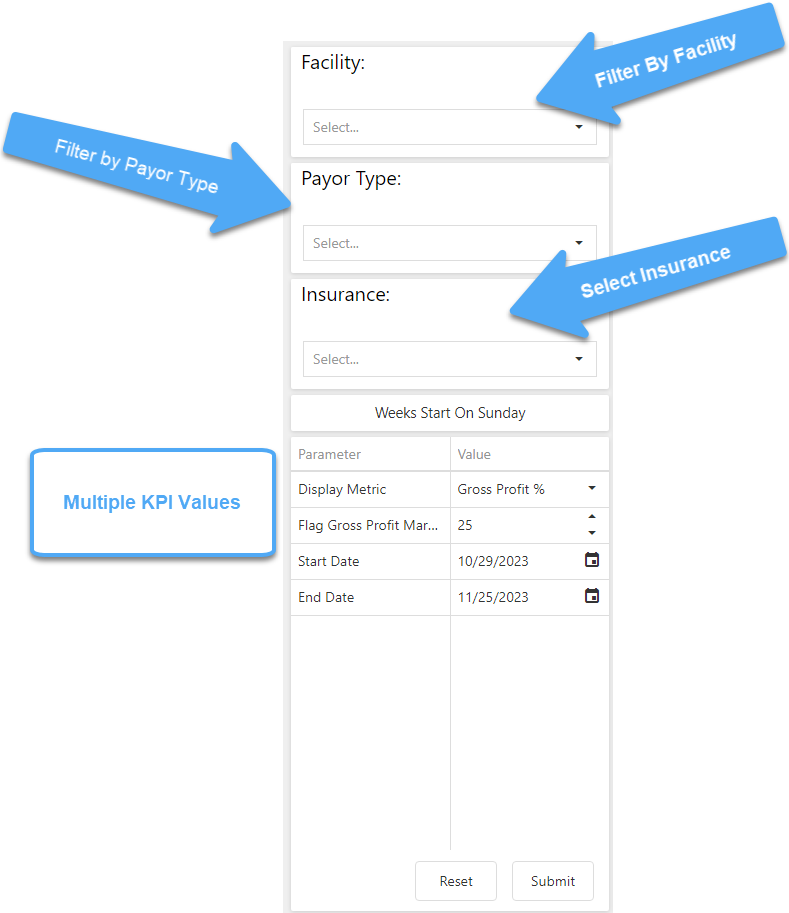
Multiple Filtering Capabilites
